Quick answer:
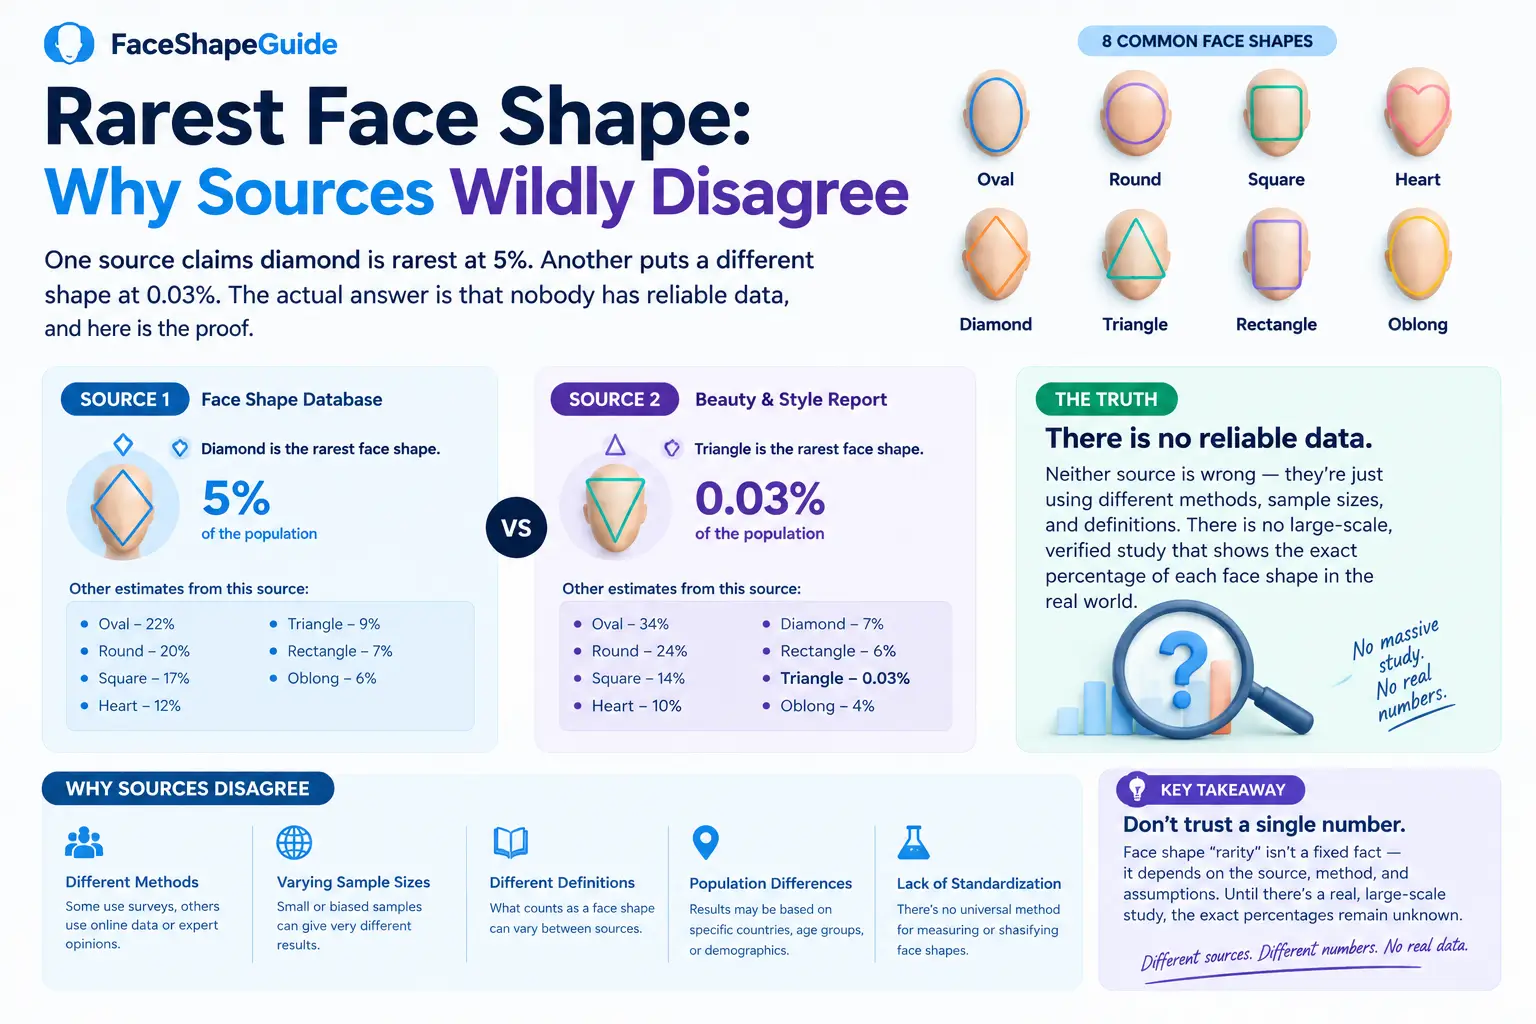
Nobody reliably knows, and this is one of the few places on this topic where that claim comes with direct proof rather than just caution. Public sources that state a specific rarest face shape do not agree with each other, and the disagreement is not close.
One widely repeated figure names diamond as rarest at around 5% of people. A separate, independently reported dataset names square as rarest at 1.6%, in the same breath reporting diamond as the third most common shape in that dataset at 10.7%, not rare at all. A third source names triangle as the overwhelmingly rarest shape at 0.03%, a claim two orders of magnitude more extreme than the “5%” figure quoted for a different shape elsewhere. Three sources, three different answers, and they cannot all be describing the same population.
The disagreement, laid out directly
This is worth seeing side by side, because the scale of it is the whole point.
| Source claims this shape is rarest | At roughly | And in that same source, diamond is |
|---|---|---|
| Claim A | Diamond, ~5% | Rarest, by definition |
| Claim B | Square, ~1.6% | Third most common, ~10.7% |
| Claim C | Triangle, ~0.03% | Not addressed in that ranking |
Notice what happens to diamond alone across these three claims: rarest in one, moderately common in another. That is not rounding error or methodology nuance. That is three sources that are not measuring anything comparable, dressed up as if they are.
Why the numbers disagree this badly
Four real reasons, not a shrug.
- Self-selected samples, not population surveys. Every figure quoted anywhere on this topic, including any published elsewhere on this site, comes from people who chose to use a face shape tool, not a random sample of the population. People curious enough to search “what’s my face shape” are not a representative cross section of everyone, and different tools attract different audiences.
- Different numbers of categories. Some systems use 6 shapes, some 7, some 8. A shape absorbed into a neighbouring category in a 6-shape system disappears from that count entirely, which alone can turn “rare” into “nonexistent” or the reverse depending on which system a given source used.
- Classifier bias toward the “default” category. One dataset explained this directly: when a face does not strongly express a specific shape’s features, an automated classifier tends to fall back to labelling it oval, since oval is treated as the balanced reference point. That inflates oval’s reported share and can starve every other category, purely as an artefact of how the classifier was built, not because of anything true about actual face shapes in the population.
- Sample size and self-reporting without independent verification. Numbers like “3,803 scans” or “1,995 faces” sound rigorous, and the underlying counts may be entirely real. What is not verifiable from outside is whether the classification each face received was accurate, since nobody has cross checked those results against an independent measurement. A precise looking percentage built on an unverified classification is not the same thing as population data, even when the sample size is genuinely large.
If you searched “worst” or “ugliest” instead
Some searches on this exact topic are phrased that way, and it is worth answering directly rather than ignoring it: no face shape is worse than another, and no face shape is uglier than another. That framing has a specific, traceable origin rather than being a natural fact about faces. Hollywood makeup artists invented face shape categories in the 1930s specifically to move faces toward a single “ideal” shape, oval, which is why oval is still called ideal in styling guides today almost a century later. That premise was a sales tool, not a measurement, and the full history is on the face shape chart page. A shape’s rarity, even if it were reliably known, would say nothing about how it looks. Rare and common are population facts. Attractive and unattractive are not facts this page, or any honest source, can hand you.
What you can actually know
Not your population rarity, since nobody has that reliably. Your own measured shape, which this site’s tools give you directly rather than asking you to guess or compare yourself to a disputed statistic.
- The face shape detector measures your proportions from a photo in about ten seconds
- The face shape calculator does the same from four tape measurements, no photo required
- The face shape chart shows the exact thresholds used for all 8 shapes, so your result is checkable rather than a black box
FAQs
What is the rarest face shape?
There is no reliable answer, and the disagreement between sources proves it rather than just suggesting it. Different public sources name diamond, square, and triangle as the rarest shape, with figures ranging from about 5% down to 0.03% for each shape claimed to be rarest. These figures come from self-selected samples of people using face shape tools, not population surveys, and cannot be reconciled.
Why do face shape rarity statistics disagree so much?
Four main reasons: every sample is self-selected rather than a random population survey, different sources use different numbers of shape categories, automated classifiers tend to default ambiguous faces to whichever shape is treated as the balanced reference point, and large sample sizes do not verify that the underlying classifications were accurate.
Is there a worst or ugliest face shape?
No. That framing treats appearance as a competition with a correct answer, which it is not. The idea that some face shapes need correcting toward an ideal traces back to a 1930s Hollywood styling convention built around a specific commercial goal, not a fact about faces. No shape is better or worse than another.
Is diamond really the rarest face shape?
It is commonly claimed to be, but at least one independently reported dataset puts diamond as the third most common shape in its sample, while naming a different shape as rarest. Treat any single rarity claim, including the common one about diamond, as unverified rather than settled.
How many face shapes are there?
This site uses 8: oval, round, square, oblong, rectangle, heart, diamond and triangle. Other sources use 6 or 7, usually merging oblong and rectangle since separating them requires reading jaw contour rather than just proportions. The face shape chart covers this in full.
Can I find out my own face shape rarity?
Not reliably, since no trustworthy population data exists for any face shape. What you can find out is your actual measured shape, using the face shape detector or calculator, which tells you something real about your own proportions rather than an unverifiable population statistic.
Reference on the general topic: demography.